Page Statistics
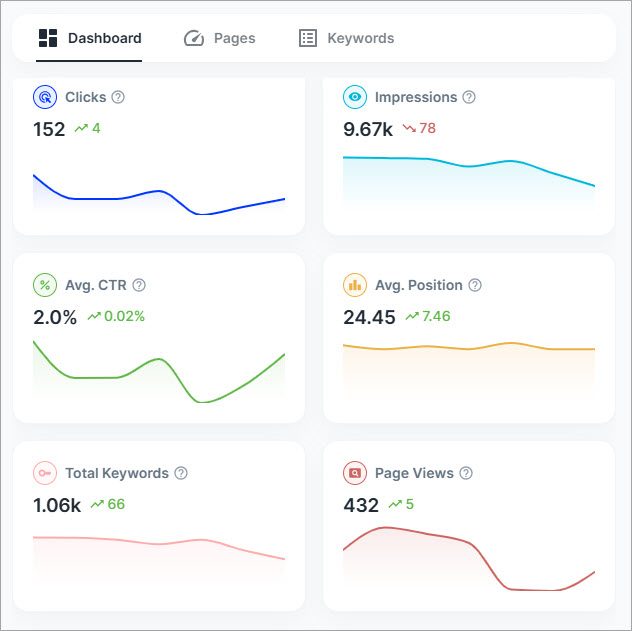
This section summarizes overall SEO performance using key metrics:
- Clicks - The number of times users clicked your pages from search results
- Impressions - The number of times your pages appeared in search results
- Avg. CTR - The average click-through rate.
- Avg. Position - Average ranking position across search results
- Total Keywords - Number of keywords your site ranks for.
- Page Views - Total number of visits to your pages. This metric is from Google Analytics.
Each metric includes:
- A current value
- A trend graph
- A change indicator compared to the previous period
Keyword Positions
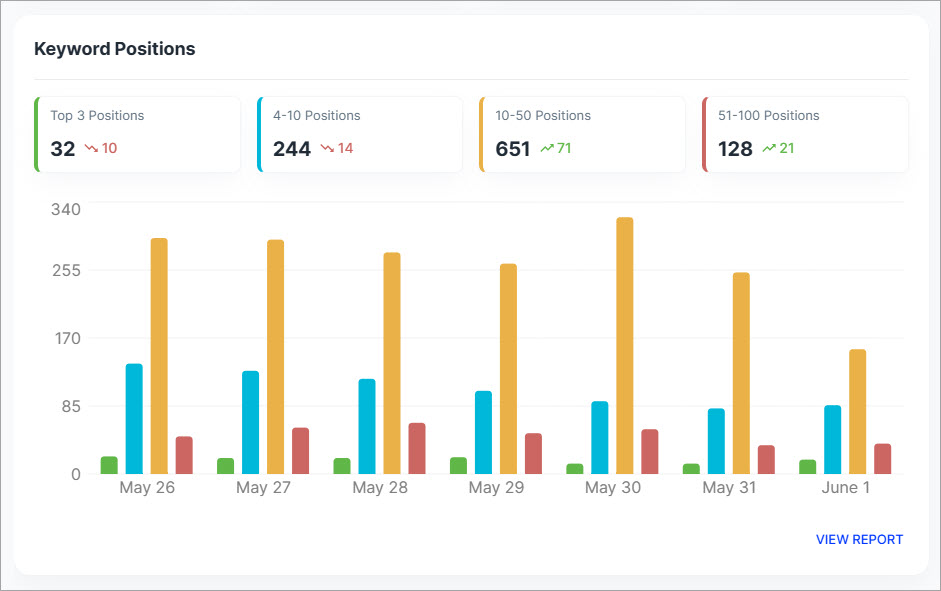
This section shows how your keywords are distributed across ranking ranges:
- Top 3 positions
- 4-10 Positions
- 10-50 Positions
- 51-100 Positions
For each range, you can see:
- The number of keywords
- The change compared to the previous period
This helps you understand how much of your content is ranking in high-visibility positions and where improvements are needed.
Winning and Losing Pages
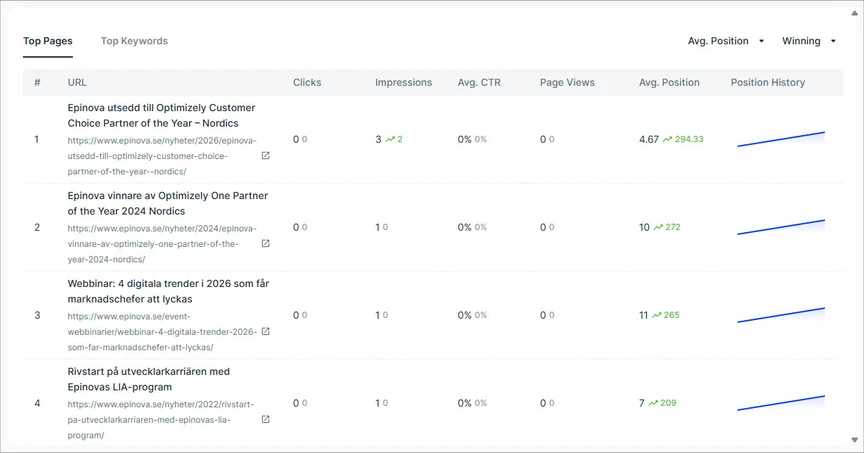
This section highlights pages with the most significant ranking changes.
- Winning Pages - Pages with the largest improvements in search rankings
- Losing Pages - Pages with the biggest drops in search rankings
Each list shows the top 5 pages, helping you quickly identify content that is performing well or needs optimization.
Winning and Losing Keywords
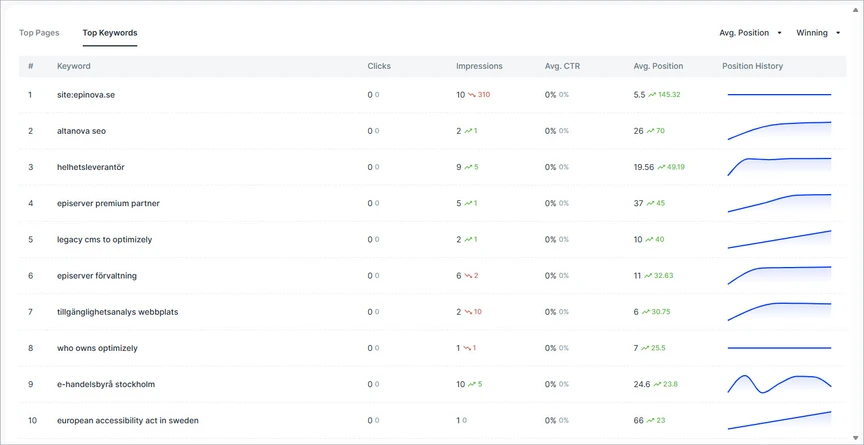
This section focuses on keyword-level performance changes.
- Winning Keywords – Keywords with the biggest ranking gains
- Losing Keywords – Keywords with the largest ranking drops
Each list shows the top 5 keywords, giving you insight into which search terms are driving growth and which may require attention.